Forecasting PPC results is a very tricky science and one which agencies are often cautious to attempt. There are a couple of things that make it difficult: every market is different; and the fact that there are multiple variables which we cannot control.
However there are a couple of things we can do to allow us to make an educated guess at forecasting our results, one of which is using excel to make a model.
To do this, the first things you will need are a few months’ relevant data (ideally these need to be from your own AdWords account).
Using this data you need to calculate two constants:
1. click-through-rate (CTR)
2. average position. (***THIS PART IS VERY CRUDE***)
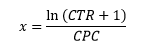
For the CTR constant (x) use: (Remember to write CTR as a decimal, not a percentage!)
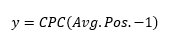
For the Avg. Pos. constant (y) use:
When calculating your constants, use several CPC and CTR values to get an average.
The more campaigns you break out the more accurate the model will be. If the CTR within the account ranges from 1% to 30% for different campaigns, the constants will be less accurate (and potentially render the model useless) than if you look at an individual campaign where the CTR has only fluctuated from 2.5% to 2.7%.
There are some obvious flaws in using this method but it works best for non-brand search, where CTR is lower and avg. pos. is 2-4. (You just need to be realistic with the CPC)
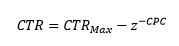
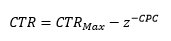
If you do want to create a model for an own brand campaign (where CTR is 30%+ and average position is already optimised) it works better if you use the following equation to calculate the constant (z):
I’d recommend using an equation solver to calculate this one, but it’s easy to get to this stage:
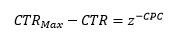
(CTRMax is the maximum possible CTR; as if you were in a 1.0 average position. This will most likely be an estimate)
Once you have these constants put them into separate cells at the bottom of your spreadsheet.
Now we can start building out the actual table:
What fields you include depends upon the client, but let’s start by looking at the traditional fields:
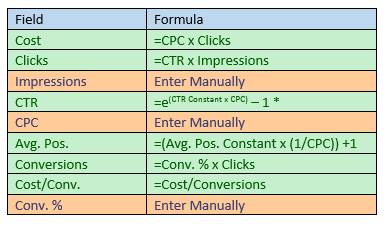
*For campaigns with high CTR use:
The green fields are calculated, and the orange fields are filled in manually. Impressions and conversion rate can be taken from historic data.
For the CTR and Avg. Pos. fields, make sure to add dollar signs in front of the cell numbers containing the constants.
Once all this is done you’re ready to go, and it’s dead easy to compare how different conversion rates or CPCs will impact your conversions.
You can then enhance your model by adding rows for revenue and ROI. This way you can estimate how high your bids can go until your ROI drops too low, or how much you need to improve your conversion to get the results you want.
This works nicely for shopping campaigns too (although for shopping you don’t need to bother with average position).
As I mentioned at the start this is a very crude model and certainly isn’t perfect, but it works quite nicely as guide, and is a great way of demonstrating how increasing spend or improving conversion rate can impact your business.
When using this method it’s important to be realistic with the CPC increases you make, but as long as you don’t stretch the limits too much it does a nice job.
The next challenge is to find the equation which will work for all situations… maybe some kind of f-curve incorporating both equations… but for now this will do the trick.