"Today, we are unifying our business intelligence product family under the Looker umbrella. Looker is the name you’ll hear us use when talking about our Google Cloud business intelligence products, as we bring together Looker, Data Studio, and core Google technologies like artificial intelligence (AI) and machine learning (ML)."
--
Data Studio is Google’s free data visualisation tool. By linking it with sources like Google Ads, Analytics, and a whole host of third-party connectors, you can display practically any data in a visual and easy-to-understand format.
Following Data Studio’s launch in mid-2016, there have been a whole host of updates. It was finally taken out of Beta phase in October 2018. From humble beginnings with tables and graphs, there are now hundreds of extra bells and whistles you can add to your Data Studio creation.
How to Speed Up Google Data Studio Reports
That’s all well and good. But despite the fact that these dashboards can answer complex business questions, facilitate data analysis and look extremely slick, we always hear the same complaint; “my dashboard is too slow”.
If your dashboard is running at a snail's pace and you’re left with buffer face that would leave Kevin Bacon distraught, these five tips will sort that right out. And if they don’t, just get in touch and we’ll take a look under the hood.
1. Reduce the Number of Charts on Each Page
Data Studio works by querying the data source you’re using. It pulls these queries individually for every chart. If you’ve managed to squish 30 tables onto one page of your dashboard, you’re going to be making 30 individual queries when that page loads. That takes time.
Consider replacing multiple widgets with a single one. A group of scorecards that are using the same data source and filters could be replaced by a table.
Top tip - You can build tables without a dimension, meaning you essentially just have a totals row.
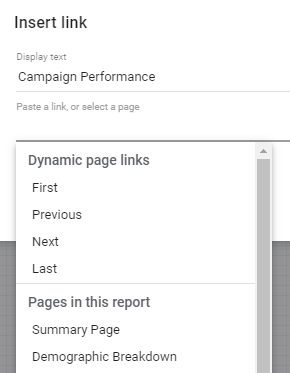
If your page is still chart-heavy, consider splitting your dashboard across multiple pages. While the report as a whole will still contain the same information, there will be fewer queries per page they will load faster.
Top tip - Use navigation links to make it easier for users to move around your multi-page dashboard.
2. Tweak Data Freshness
When you first open a page of your Data Studio dashboard, a query is made to your data source, and information is returned. If you close your dashboard and revisit it later that day, another query is made.
If your data doesn’t update very often, or if your report is solely focussed on data that’s in the past, these frequent queries are a little unnecessary. We can avoid these process-heavy queries by relying on the browser’s cache.
Caching is where your browser makes a local copy of the information, so it can be viewed again without having to make a call to the information source. This is why you might sometimes see old versions of a website, despite there being a server-side update.
To control how often Data Studio refreshes your data, you’ll need to change the setting of the Data Source called “Data freshness”. Be aware that this isn’t available for all sources. Google Ads and Analytics, for example, are fixed at 12 hours.
3. Keep Data Processing Outside of Data Studio
The ability to create custom fields in Data Studio makes it incredibly versatile. A common use case here at SearchStar is grouping marketing campaigns into themes to allow for top-line reporting.
For example, we might use the CASE function to create a new field called Campaign Type, which separates out our Prospecting and Re-marketing display campaigns, based on the campaign, ad content, and term fields in Google Analytics.
While the table we create using this will only have two rows of data, Data Studio will first need to query our data source at a granular level to build the custom field. This is process heavy and will lead to slow load times.
Using custom dimensions in Analytics, we could achieve this logic before the data enters Data Studio, meaning the query needed is much more lightweight. If it’s not possible to offload data processing like this for your data source, you might be able to achieve the same result with Google Sheets as a middle man, or an enterprise solution like Google Big Query.
There are also third-party providers like Funnel.io where you can aggregate data from multiple sources and create custom fields, before pushing it to Data Studio.
4. Clear Your Clipboard
When you’re building a Data Studio dashboard it’s likely that you’ll be copying and pasting objects across pages or whole reports. The items you copy will be stored in the application’s local storage. The more you copy, the bigger this object will be, potentially slowing down the Data Studio application.
To clear your clipboard open your Data Studio report in Chrome and open Developer Tools (F12 / Ctrl+Shift+I / Commans+Option+I). In the top navigation choose ‘Application’, and open ‘Local Storage’ > https://datastudio.google.com. Find the object with the key ‘ClipBoard’ and delete it.
5. Minimise the use of Segments
Using Google Analytics segments in your Data Studio dashboard is a great way to understand the performance of a subset of users. However, these labour-intensive overlays can massively slow down your reports. In some cases they’re unavoidable, but using filters is often a more efficient alternative.
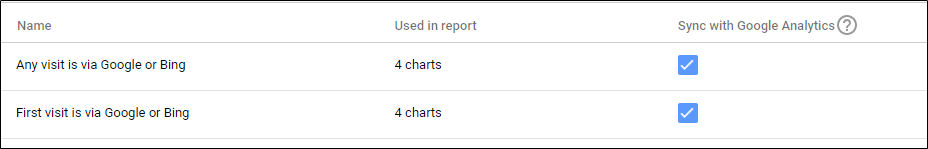
When you use segments you’re given the option to synchronise with Analytics. This means if a segment is updated in Analytics, the change trickles down to Data Studio. However, this synchronisation means the report has to update the segment every time your report loads. If your segment is not likely to change, consider deactivating segment synchronisation to speed up your dashboard.
Final Thoughts
Data Studio is a brilliant tool. It’s great for agencies, in-house marketers, and anyone who wants to visualise data. But it can be extremely frustrating when a tool doesn’t perform as well as you’d like it to.
Hopefully, these tips have helped you speed up your Data Studio dashboards so you can spend less time starting a loading screen and more time understanding your data and using it to make a positive impact.
If you’re just starting out with Data Studio or want help taking your reports to the next level, get in touch with the team here...