Written byLukas BeelerSenior Conversion Consultant
TopicWeb Analytics
Date02.04.20
Web analytics tools - most commonly Google Analytics - are essential if you want to derive insight from what users are doing on your website. Not only is it important to track the number of sales you’re making or the volume of leads being generated, properly analysing your data can offer actionable insight.
What we mean when we talk about actionable insight is data that can inform improvements to your website or advertising that would have been impossible to carry out without analysis. But deriving truly useful insight from all that data can be tough and, of course, there are a number of pitfalls to be avoided when navigating Google Analytics.
So, with that in mind, we’ve summarised five essential Google Analytics tips that you can take away and use to get your hands on that actionable insight and start making improvements across the board.
5 Google Analytics Tips for Actionable Insight
1) Segment Data Meaningfully
There are a seemingly infinite number of dimensions that you can use to segment data in Google Analytics. These enable you to piece together a much better picture of what’s actually going on, on your site.
For example, if you were to look at your best and worst performing landing pages, and you see that one of your landing pages has a high bounce rate and low conversion rate, you might conclude that the page is performing poorly.
Dig a little deeper, and you could uncover that it’s receiving a disproportionately high amount of top-of-funnel or low-quality traffic, which is causing these metrics to look poor. By comparing landing pages after creating a segment of a specific traffic type, we can form a stronger sense of a page’s performance in relation to others.
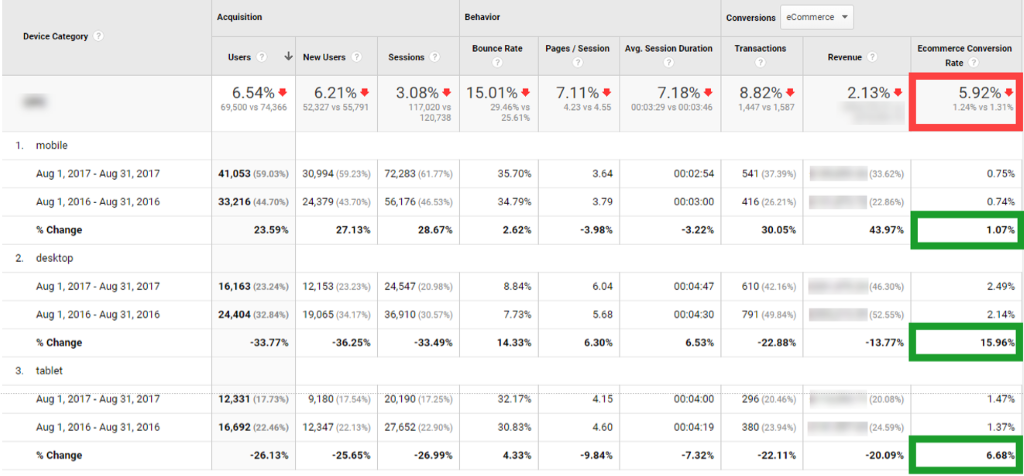
Without meaningful segmentation, it’s difficult to get useful and actionable insight - data in aggregation can be useless or misleading.
Without segmentation, we wouldn't be able to see that conversions on each device has actually gone up even if the overall conversion rate is down.
2) Answer Your Business Goals
Drawing out the most valuable insight from your analytics data means focusing on what matters most to your business. By starting your process with a business question, you can focus on metrics that will have an tangible benefit to your business; revenue or key conversions.
This process of understanding what’s important to your business also enables you to ensure that you’re making changes to your website or strategy that help you actually improve business performance, rather than vanity metrics.
If you’re not sure where to start, a KPI workshop involving different stakeholders will help you identify what metrics are the most important to helping your business grow.
Start with a question like “how can I sell more beds?” or “why are fewer people making enquiries this month than last month?”. Doing so means it becomes easier to gain useful, actionable insight from your data, rather than focusing on metrics which don’t have a significant impact.
3) Take External Factors Into Account
Many marketing managers are focused on improving month-on-month. While this is important, it is also important to remember that if performance is down one month, it could be down to a number of external factors rather than anything you’re doing wrong.
Seasonal trends are clear for many businesses, but some downplay the impact of seasonality on their business. So, looking at month-on-month changes in previous years can help identify trends that you may have missed, especially if the impact was limited.
Looking at another example, it’s all too easy to attribute an increase in organic traffic to a successful SEO strategy, but a print brand campaign could be the true reason. Without taking external factors like this into account, you might be inferring causation between your digital marketing actions and performance.
Remember, this goes both ways; external factors could be causing your performance to drop even if you’ve made positive changes to your strategy at the same time.
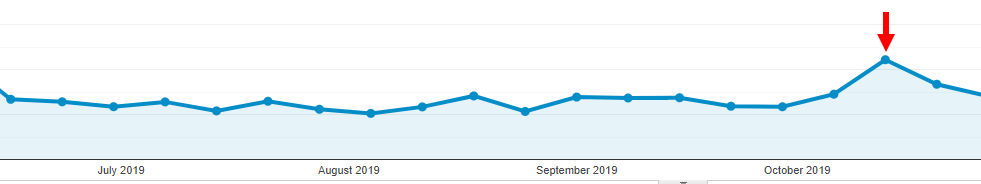
Our October conference last year led to a large increase in traffic to the SearchStar site!
4) Look At Your Users’ Journeys
Start by looking at your top landing pages and segment by device and traffic source. After all, your organic desktop traffic will likely not be landing on the same pages as your mobile Facebook traffic.
This will give you a good idea about where users are starting their journeys, and the entrance paths tab in the landing pages report shows where users are going next from a chosen landing page.
The navigation summary in the all pages report can then show how users are navigating through subsequent pages. It’s interesting at this point to create a segment of converters and one of non-converters - this can show how the journeys of converters and non-converters differ. Understanding this allows you to change up the navigation options and CTAs you prioritise on the page.
Google Analytics gives you the ability to create conversion funnels, which can help easily visualise the stage of the journey users most commonly drop off at, meaning you to know where the largest opportunities to increase conversion rate are to be found.
Furthermore, the exit pages report highlights the pages ripe for improvement. It’s often the case that pages with high exit rates demonstrate that users may not feel there is an obvious action to take or the messaging isn’t clear enough.
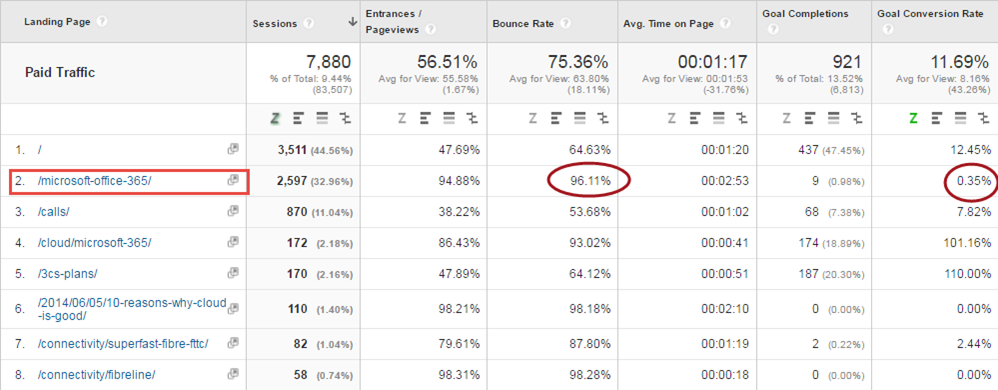
This landing page report highlights a landing page which performs much worse than others.
5) Don’t Let Bias Get the Best of You
Humans are great at recognising patterns, but we sometimes spot patterns when there isn’t one there. When making changes to your site, your natural proclivity for confirmation bias might tell us that we’ve made a positive change. Actually, that tiny uptick in a key metric is just as likely to be down to a natural variance.
Conversely, the sunk cost fallacy often causes us to continue with a chosen strategy just because we’ve spent a long time investing in it, even if it’s not actually performing better!
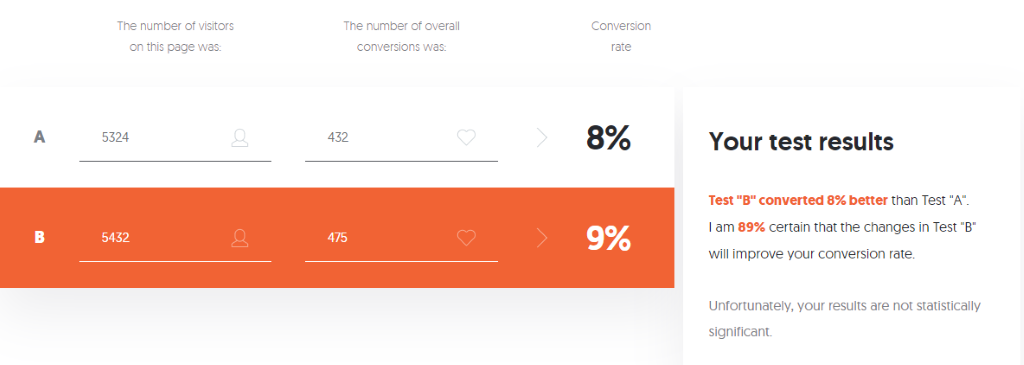
By using a statistical significance calculator, we can ensure confidence in perceived correlation between a change in strategy and the performance of your site. But remember, correlation doesn’t - necessarily - mean causation!
Despite an 8% uptick in conversion rate, this change on the site has not led to a statistically significant result, so we need to collect more data before we can be confident that the change has led to the improvement in performance.
Final Thoughts
Now you’ve got some great tips to work with to gain truly valuable insight from your Google Analytics data. But you’ve still got to ask yourself “so what?”. How are you going to use your new-found knowledge to improve your site’s performance and, most importantly, how is that going to add value to your business?
The tips above only scratch the surface of what’s possible with most analytics tools, but they will act as a good starting point for helping report with insight.
If you’d like to start going more in-depth with analytics and conversion, you can sign up to one of our upcoming webinars or, even better, one of our upcoming analytics training days.